Read and Filter Logs
The Logs page streams log entries from every app and framework component in real time. Filter and search controls narrow the view to specific entries.
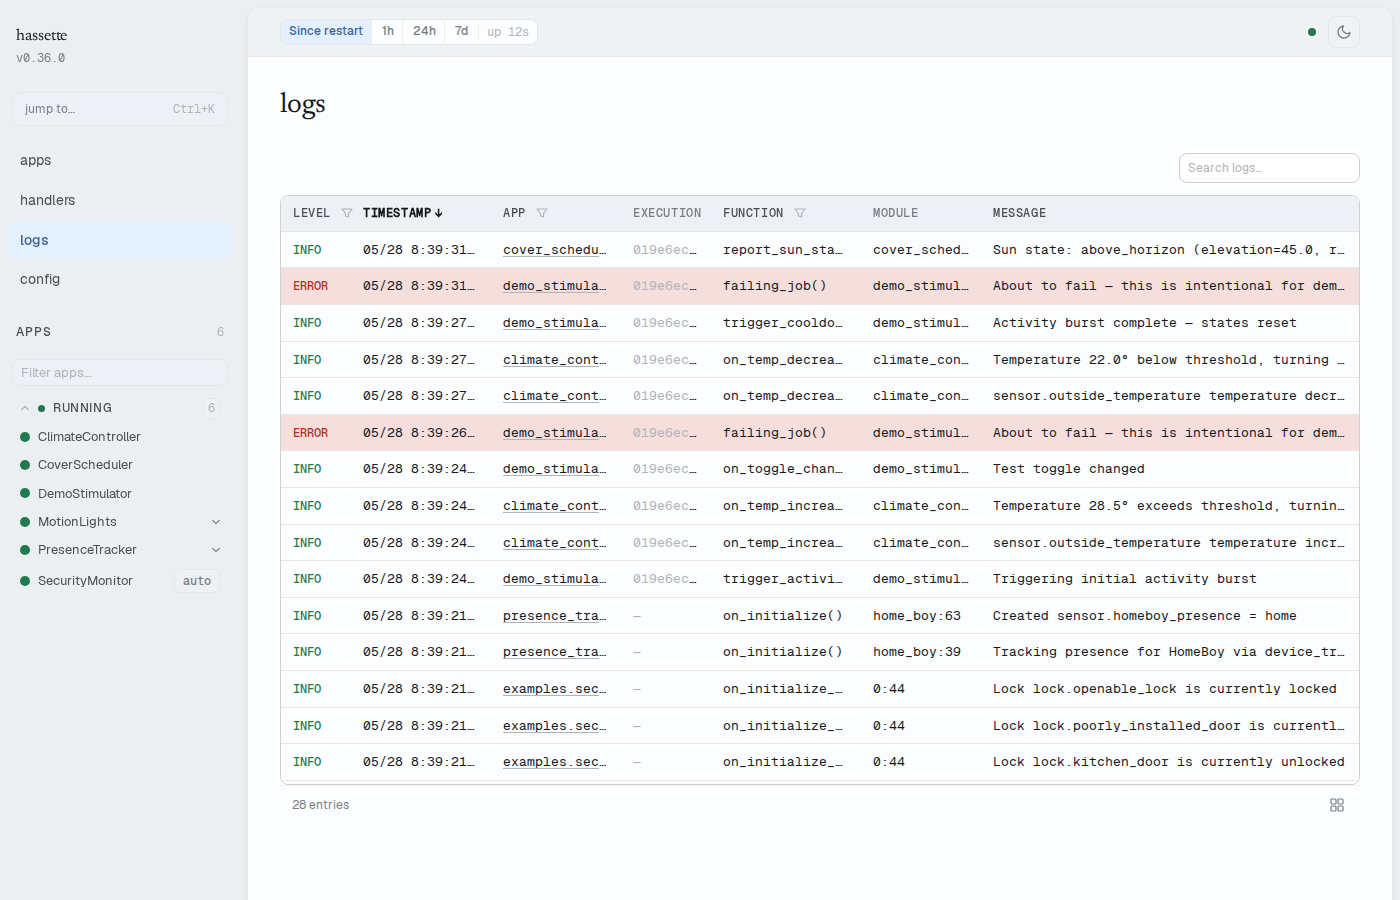
Filtering and Search
The filter controls narrow the table to specific entries.
Level sets the minimum severity shown. It defaults to INFO. Options are: All levels, DEBUG+, INFO+, WARNING+, ERROR+, and CRITICAL only.
App limits entries by source. Toggle between All, Apps, and Framework. The default is Apps. When All or Apps is selected, a dropdown narrows to a specific app key.
Function filters the function name column by substring. Any part of a function name matches.
Search matches against both message content and logger name.
The footer shows how many entries match. When the result exceeds 500, the footer reads "showing 500 of N". Narrowing the filters surfaces specific entries.
Trace a Single Execution
Appending ?execution_id=<id> to the URL filters the table to entries from one handler or job execution. The Debug Handler page links here automatically from execution history. The URL can also be constructed manually from an execution ID found in logs or the CLI.
When an execution ID filter is active, the other filters use local state. They do not modify the URL, so the execution ID stays intact as the view is refined.
Log Table Columns
The table is sorted by timestamp descending by default. Sortable columns toggle between descending and ascending on click.
| Column | Sortable | Filterable | Description |
|---|---|---|---|
| Level | Yes | Yes (dropdown) | Severity badge: DEBUG, INFO, WARNING, ERROR, CRITICAL |
| Timestamp | Yes (default desc) | No | Time the entry was recorded |
| App | Yes | Yes (dropdown) | App key, or blank for framework logs |
| Instance | No | No | Instance name for multi-instance apps |
| Execution | No | No | Execution ID linking to a handler invocation |
| Function | Yes | Yes (text input) | Python function that emitted the log |
| Module | No | No | Python module name |
| Message | Yes | No | Log message text |
Column Picker
The grid icon in the table footer opens a column picker. Each column has a checkbox to toggle visibility. Level and Message are required and cannot be hidden.
Some columns auto-hide at narrow viewport widths. Those columns appear disabled in the popover with a "Hidden at this screen size" tooltip. They cannot be toggled until the viewport widens. Reset to defaults restores the default column set.
Note
The column picker does not appear on mobile viewports. The table uses a compact layout there instead.
Log Detail Drawer
Clicking any row opens the detail drawer with the complete entry.
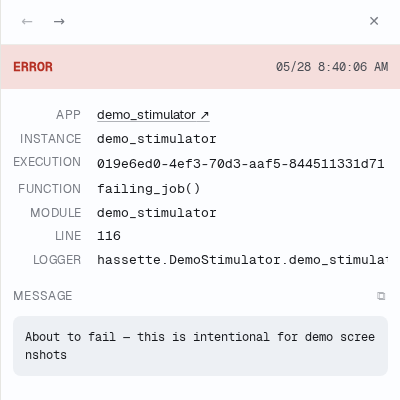
The drawer shows a severity badge, full timestamp, and a metadata grid. The grid includes app (linked to its detail page), instance, execution ID, function name, module, line number, and logger name. The execution ID has a copy button.
Below the grid, the full message appears in a scrollable block with a copy button. Entries with exception info show a separate code block beneath the message.
The arrow keys move between entries without closing the drawer. Escape closes it.
On desktop the drawer opens as a side panel. On mobile and tablet it appears as a bottom sheet.
Live Streaming
New entries appear as they arrive. No refresh needed.
Streaming is active only when the table is sorted by timestamp, the default. Sorting by any other column pauses streaming so incoming entries do not disrupt the sort order. A "paused" button appears in the footer. It resets the sort to timestamp-descending and resumes live updates.
Related pages
- Web UI overview: layout, navigation, and how to enable the UI
- Debug a Failing Handler: execution history with links to filtered logs for each run
- Database and Telemetry: how log entries are persisted and retained