Web UI
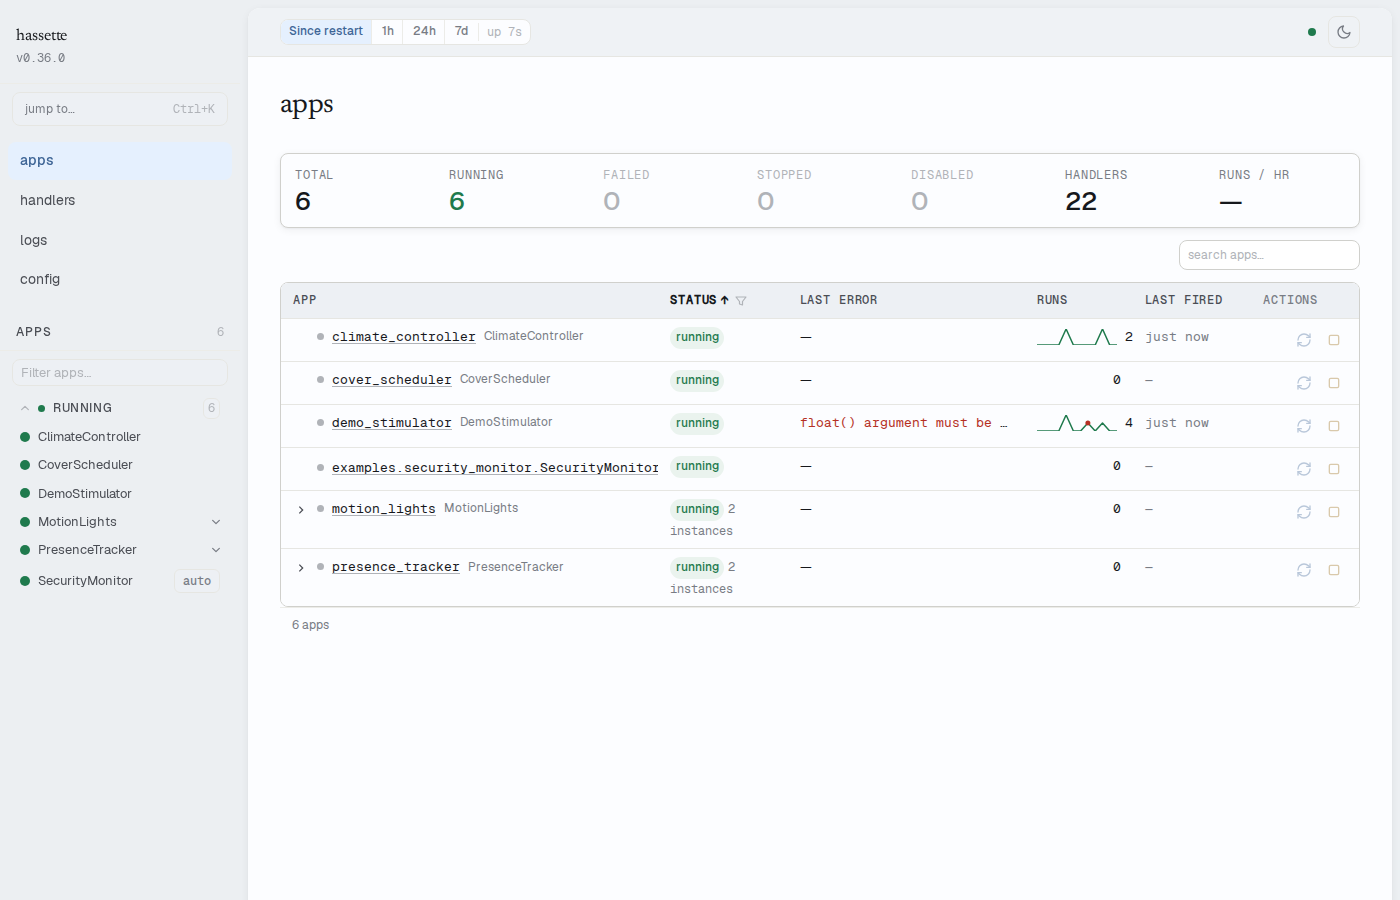
The web UI shows app health, handler invocation history (a handler is a function your app runs when a Home Assistant event occurs), structured logs, and system configuration.
Enabling and Accessing
The web UI is enabled by default. Open your browser to:
http://<host>:8126/
The default bind address is 0.0.0.0:8126. The host and port fields under [hassette.web_api] in hassette.toml control the bind address.
No authentication
The web UI has no built-in authentication. The default bind address 0.0.0.0
makes it reachable by anyone on the local network, including endpoints that
start, stop, and reload automations.
For local-only access, set host = "127.0.0.1" under [hassette.web_api].
For remote access, place Hassette behind a reverse proxy with authentication
(Caddy, nginx, and Traefik all work).
The UI can be disabled independently while the REST API stays active:
[hassette.web_api]
run_ui = false
First run
A fresh Hassette install shows empty tables and zero counts until automations run and handlers fire. As your apps react to Home Assistant activity, the tables fill in with timing data, log entries, and run history.
Configuration
Configuration quick reference
| Setting | Type | Default | Description |
|---|---|---|---|
[hassette.web_api] run |
bool | true |
Enables the web API service (REST API + UI backend) |
[hassette.web_api] run_ui |
bool | true |
Serves the web UI (requires run = true) |
[hassette.web_api] host |
string | "0.0.0.0" |
Bind host |
[hassette.web_api] port |
int | 8126 |
Bind port |
[hassette.web_api] cors_origins |
tuple | ("http://localhost:3000", "http://localhost:5173") |
Allowed CORS origins |
[hassette.web_api] event_buffer_size |
int | 500 |
How many recent events the UI keeps in memory |
[hassette.web_api] log_buffer_size |
int | 2000 |
How many log entries the UI keeps in memory |
[hassette.web_api] job_history_size |
int | 1000 |
Job execution records to keep |
[hassette.web_api] ui_hot_reload |
bool | false |
Live-reload on static file changes |
See Global Settings for the full reference.
Layout
The UI has three persistent navigation elements.
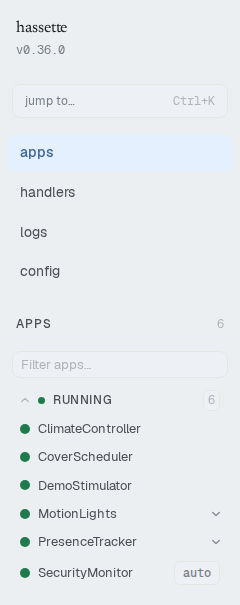
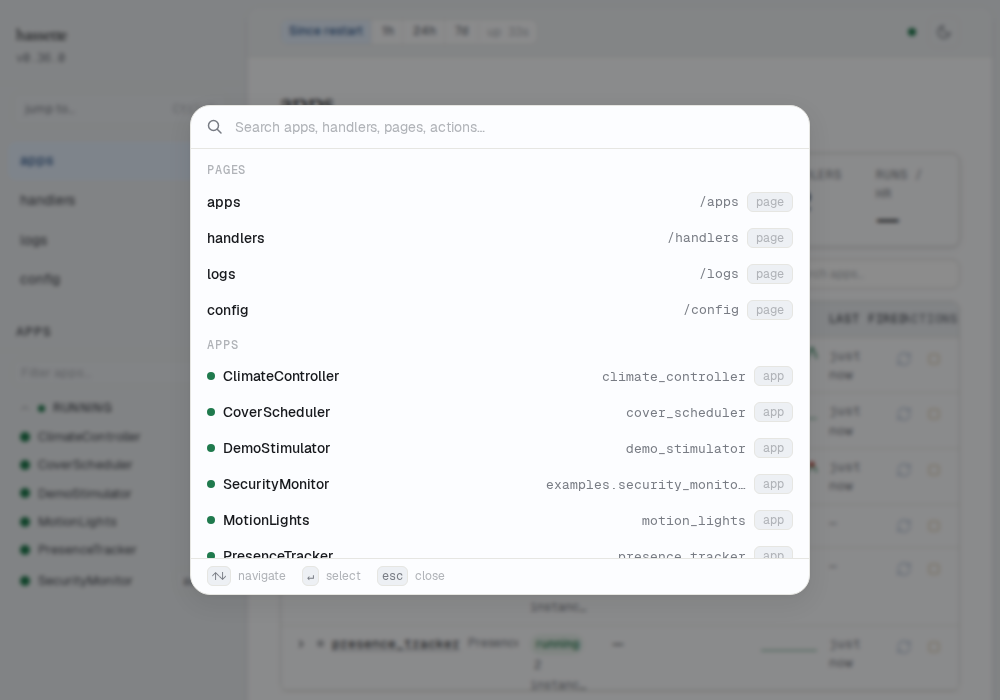
The sidebar lists every app grouped by lifecycle status: FAILING, BLOCKED, SLOW, RUNNING, STOPPED, and DISABLED. A search field filters the list by app name. The command palette opens from the search area or with Ctrl+K (Cmd+K on macOS).
The status bar runs across the top. It holds a time-preset selector (Since restart, 1h, 24h, 7d) that scopes all history views. A connection indicator, uptime counter, and theme toggle sit alongside it.

The command palette opens with Ctrl+K or Cmd+K. It jumps to pages, apps, handlers, and actions without navigating through the sidebar.
Alert banners appear below the status bar when something needs attention. Red banners indicate failed apps. Amber banners mean the UI is receiving more data than it can keep — older events or log entries are being discarded. Increase event_buffer_size or log_buffer_size in hassette.toml to keep more history.
Pages
- Manage Apps: start, stop, and reload apps; check health and status
- Debug a Failing Handler: find why a handler is not firing or is throwing errors
- Read and Filter Logs: search, filter, and stream logs in real time
- Inspect Configuration and Code: view global and per-app config, read app source
- Configure Health Checks: choose the right endpoint for restart automation, traffic routing, or monitoring